Memory Adventure

· 8 min read
Nils Wireklint
Nils Wireklint

An adventure in finding a memory thief in Starlark-land

This is a summary and follow-up to my talk at BazelCon-2023. With abridged code examples, the full instructions are available together with the code.

Problem Statement

First, we lament Bazel's out-of-memory errors, and point out that the often useful Starlark stacktrace does not always show up. Some allocation errors just crash Bazel without giving and indication of which allocation failed.
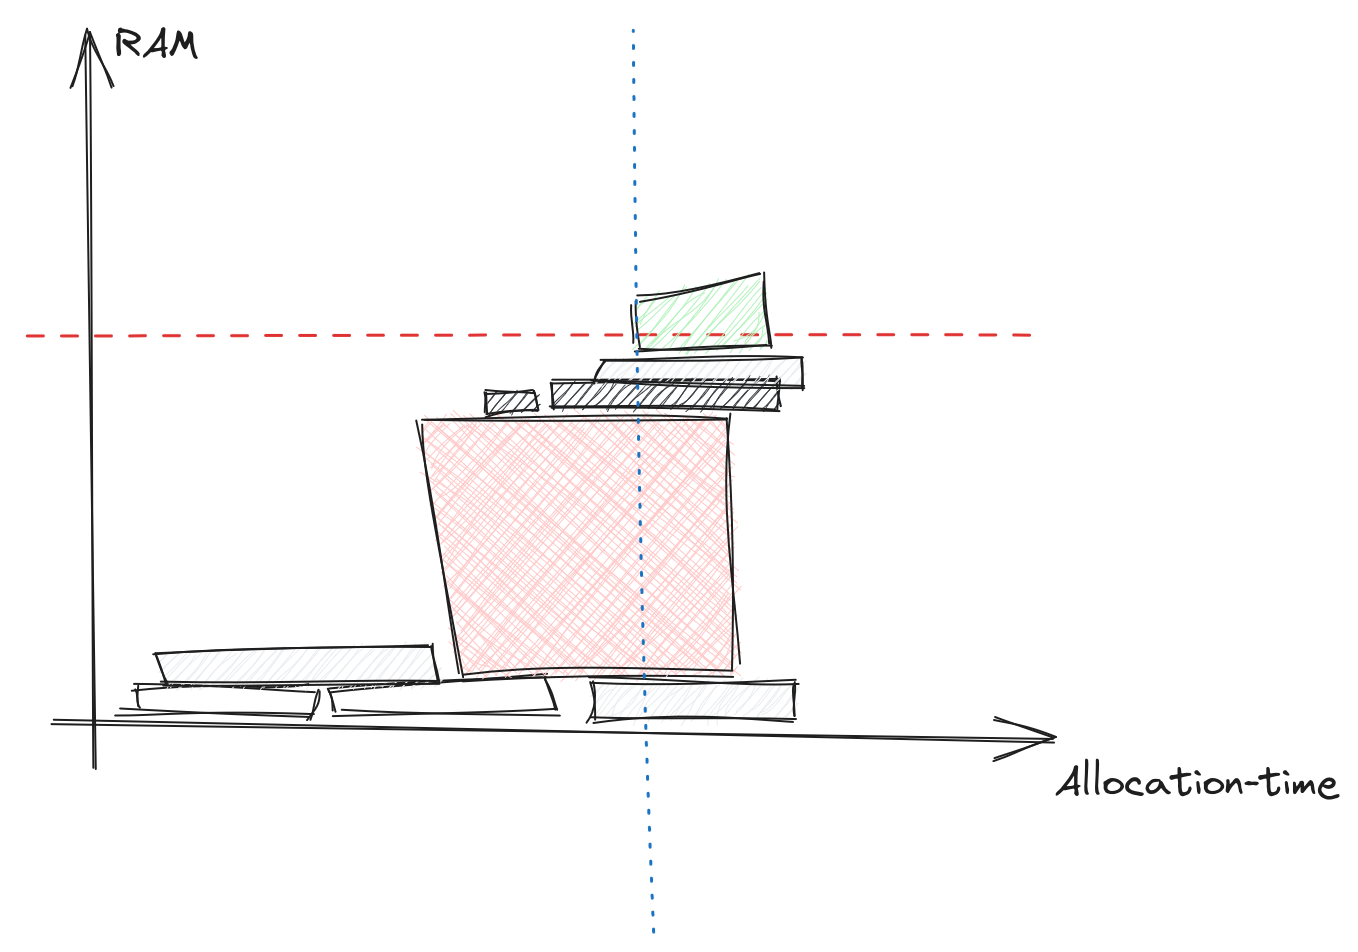
allocation

This diagram illustrates a common problem for memory errors, the allocation that fails may not be the problem, it is just the straw that breaks the camel's back. And the real thief may already have allocated its memory.

We have seen many errors when working with clients, and they typically hide in big corporate code bases. Which complicates troubleshooting, discussion and error reporting. So we create a synthetic repository to try to illustrate the problem, and have something to discuss. The code and instructions are available here.

Errors and poor performance in the analysis phase are not good at all. This is because the analysis must always be done before starting to build all actions. With big projects the number of configuration to build for can be very large, so one cannot rely on CI runners to build the same configuration over and over, to retain the analysis cache. Instead it is on the critical-path for all builds, especially if the actions themselves are cached remotely.

To illustrate (some of the problem) we have a reproduction repository with example code base with some Python and C programs. To introduce memory problems, and make it a little more complex we add two rules: one CPU intensive rule ("spinlock") and one memory intensive aspect ("traverse"). The "traverse" aspect encodes the full dependency tree of all targets and writes that to a file with ctx.actions.write. So the allocations are tied to the Action object.

Toolbox

We have a couple of tools available, many are discussed in the memory optimization guide, but we find that some problems can slip through the cracks.

First off, there are the post-build analysis tools in bazel:

  • bazel info
  • bazel dump --rules
  • bazel aquery --skyframe_state

These are a good starting point and have served us well on many occasions. But with this project they seem to miss some allocations We will return to that later. Additionally, these tool will not give any information if the Bazel server crashes. You will need to increase the memory and run the same build again.

Then one can use Java tools to inspect what the JVM is doing:

The best approach here is to ask Bazel to save the heap if it crashes, so it can be analyzed post-mortem: bazel --heap_dump_on_oom

And lastly, use Bazel's profiling information:

  • bazel --profile=profile.gz --generate_json_trace_profile --noslim_profile

This contains structured information and is written continuously to disk, so if Bazel crashes we can still parse it, we just need to discard partially truncated events.

Expected Memory consumption

As the two rules write their string allocations to output files we get a clear picture of the expected RAM usage (or at least a lower bound).

$ bazel clean
$ bazel build \
--aspects @example//memory:eat.bzl%traverse \
--output_groups=default,eat_memory \
//...
# Memory intensive tree traversal (in KB)
$ find bazel-out/ -name '*.tree' | xargs du | cut -f1 | paste -sd '+' | bc
78504
# CPU intensive spinlocks (in KB)
$ find bazel-out/ -name '*.spinlock' | xargs du | cut -f1 | paste -sd '+' | bc
3400

Here is a table with the data:

Memory for each targetTotal
Memory intensive0-17 MB79 MB
CPU intensive136 KB3.4 MB

Reported Memory Consumption

Next, we check with the diagnostic tools.

$ bazel version
Bazelisk version: development
Build label: 6.4.0

Bazel dump --rules

$ bazel $STARTUP_FLAGS --host_jvm_args=-Xmx"10g" dump --rules
Warning: this information is intended for consumption by developers
only, and may change at any time. Script against it at your own risk!

RULE COUNT ACTIONS BYTES EACH
cc_library 4 17 524,320 131,080
native_binary 1 4 524,288 524,288
cc_binary 6 54 262,176 43,696
toolchain_type 14 0 0 0
toolchain 74 0 0 0
...

ASPECT COUNT ACTIONS BYTES EACH
traverse 85 81 262,432 3,087
spinlock14 35 66 524,112 14,974
spinlock15 35 66 0 0
...

First, there are some common rules that we do not care about here, then we have the Aspects. traverse is the memory intensive aspect, which is applied on the command line and spinlock<N> are the CPU intensive rules, with identical implementations just numbered (there are 25 of them).

It is a little surprising that only one have allocations. And the action count for each aspect does not make sense either, as this is not a transitive aspect. It just runs a single action each time the rule is instantiated. The hypothesis is that this is a display problem, with code shared between rules. There are 25 rules, with 25 distinct implementation functions, but they in turn call the same function with the action. So the "count" and "actions" columns are glued together, but the "bytes" is reported for just one of the rules (it would be bad if this was double-counted).

Either way, the total number of bytes does not add up to what we expect. Compare the output to the lower-bound determined before:

| | Memory for each target | Total | Reported Total | | ---- | ---- | ----------- | | Memory intensive | 0-17 MB | 79 MB | 262 kB | CPU intensive | 136 KB | 3.4 MB | 524 kB

Skylark Memory Profile

info

This is not part of the video.

The skylark memory profiler is much more advanced, and can be dumped after a successful build.

$ bazel $STARTUP_FLAGS --host_jvm_args=-Xmx"$mem" dump \
--skylark_memory="$dir/memory.pprof"
$ pprof manual/2023-10-30/10g-2/memory.pprof
Main binary filename not available.
Type: memory
Time: Oct 30, 2023 at 12:16pm (CET)
Entering interactive mode (type "help" for commands, "o" for options)
(pprof) top
Showing nodes accounting for 2816.70kB, 73.34% of 3840.68kB total
Showing top 10 nodes out of 19
flat flat% sum% cum cum%
512kB 13.33% 13.33% 512kB 13.33% impl2
256.16kB 6.67% 20.00% 256.16kB 6.67% traverse_impl
256.11kB 6.67% 26.67% 256.11kB 6.67% _add_linker_artifacts_output_groups
256.09kB 6.67% 33.34% 256.09kB 6.67% alias
256.09kB 6.67% 40.00% 256.09kB 6.67% rule
256.08kB 6.67% 46.67% 256.08kB 6.67% to_list
256.06kB 6.67% 53.34% 256.06kB 6.67% impl7
256.04kB 6.67% 60.01% 256.04kB 6.67% _is_stamping_enabled
256.04kB 6.67% 66.67% 256.04kB 6.67% impl18
256.03kB 6.67% 73.34% 768.15kB 20.00% cc_binary_impl

Here the Memory intensive aspect shows up with 256kB, which is inline with the output from bazel dump --rules, but not reflecting the big allocations we know it makes.

Eclipse Memory Analyzer

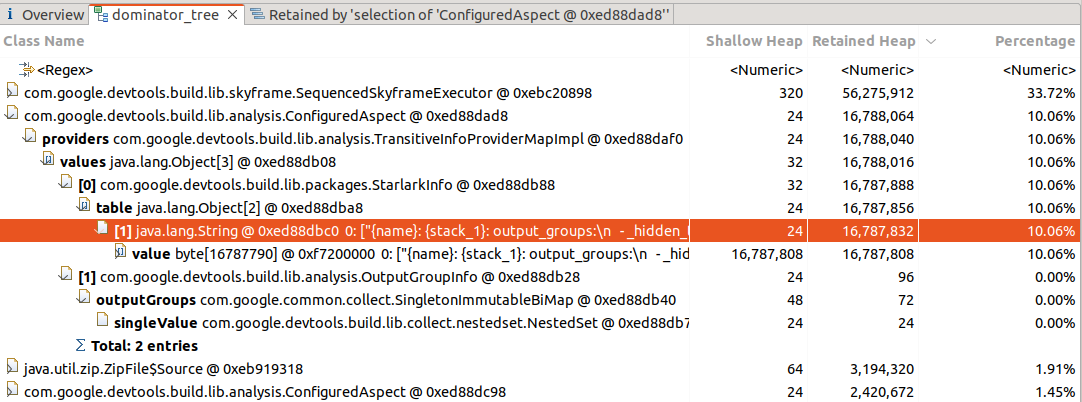
The final tool we have investigated is the Java heap analysis tool Eclipse Memory Analyzer, which can easily be used with Bazel's --heap_dump_on_oom flag. On the other hand it is a little tricker to find a heap dump from a successful build.
eclipse-analysis

Here we see the (very) big allocation clear as day, but have no information of its provenance.

We have not found how to track this back to a Skylark function, Skyframe evaluator or anything that could be cross-referenced with the profiling information.

Build Time

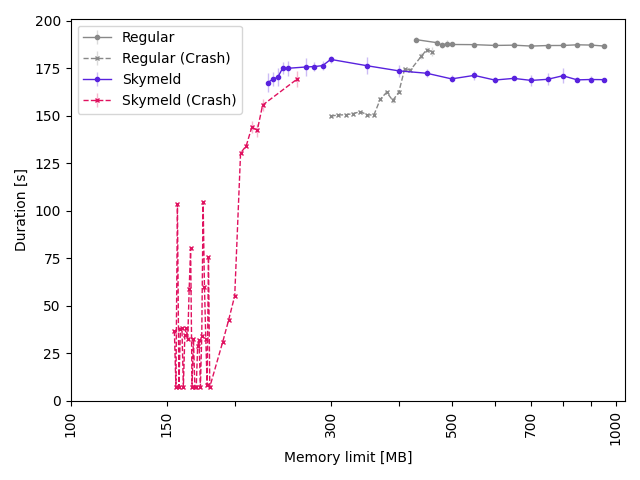
The next section of the talk shows the execution time of the build with varying memory limits.
combined

This is benchmarked with 5 data points for each memory limit, and the plot shows failure if there was at least one crash among the data points. There is a region where the build starts to succeed more and more often, but sometimes crashes. So the Crash and not-crash graphs overlap a little, you want to have some leeway to avoid flaky builds from occasional out-of-memory crashes.

We see that the Skymeld graph requires a lot less memory than a regular build, that is because our big allocations are all tied to Action objects. Enabling Skymeld lets Bazel start executing Actions as soon as they are ready, so the resident set of Action objects does not grow so large, and the allocations can be freed much sooner.

Pessimization with limited memory
pessimization

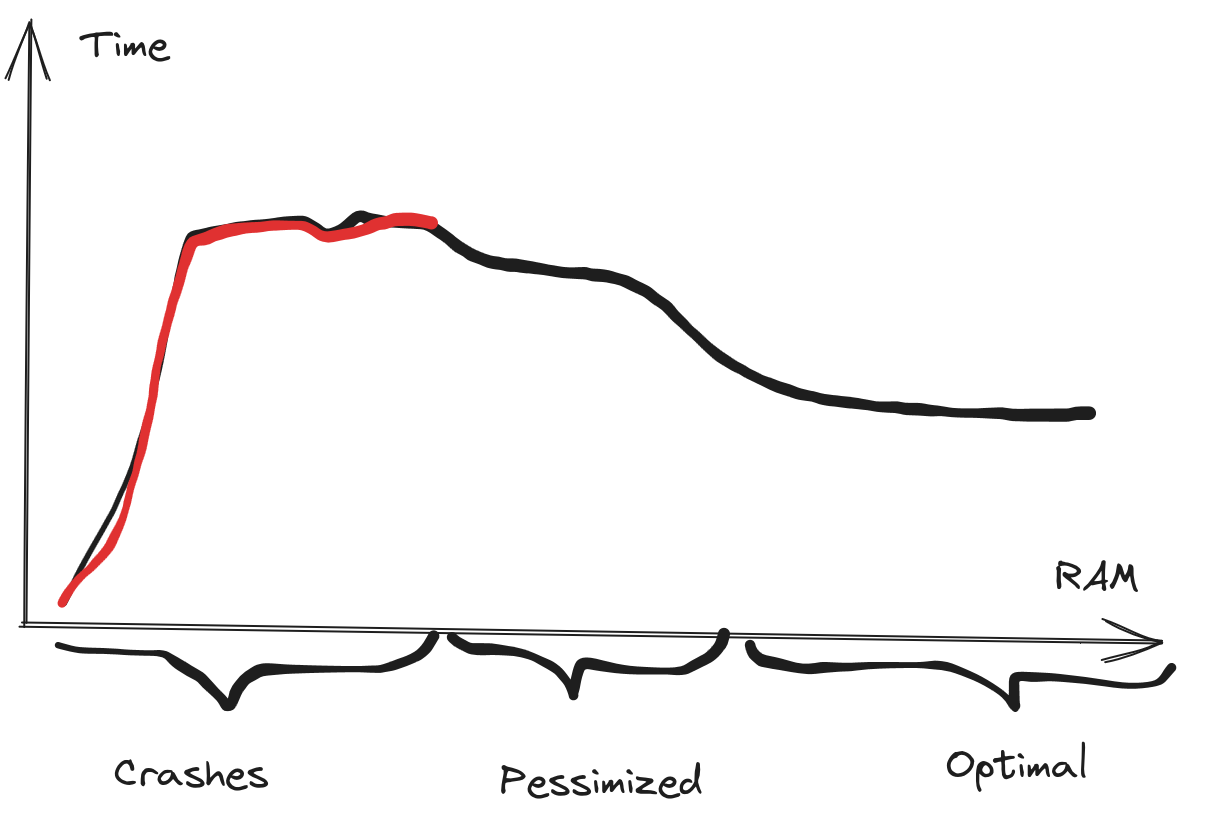
We saw a hump in the build time for the Skymeld graph, where the builds did succeed in the 300 - 400 MB range, but the build speed gradually increased, reaching a plateau at around 500 MB. This is a pattern we have seen before, where more RAM, or more efficient rules can improve build performance.

This is probably because the memory pressure and the Java Garbage Collector interferes with the Skyframe work. See Benjamin Peterson's great talk about the Skyframe for more information.

Future work
example profile

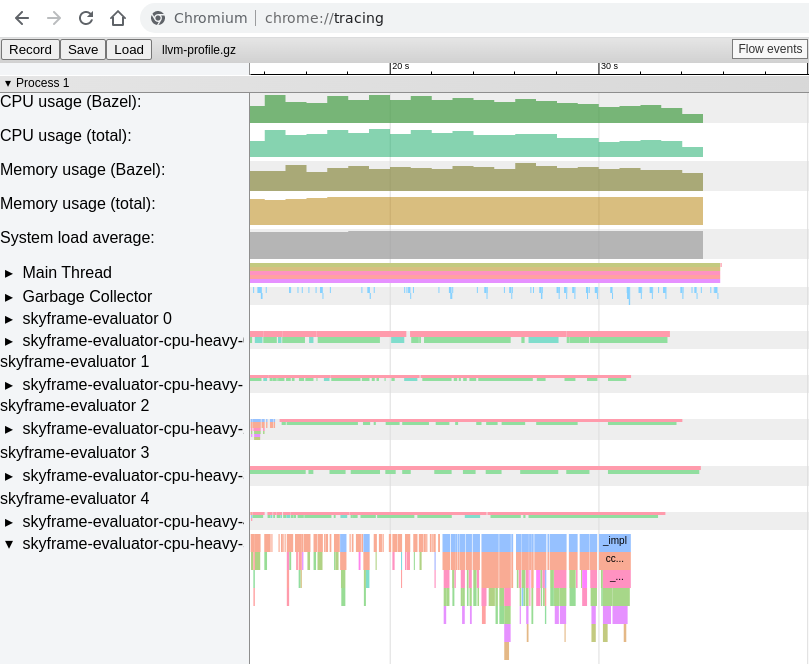
This section details future work for more tools and signals that we can find from Bazel's profile information --profile=profile.gz --generate_json_trace_profile --noslim_profile. Written in the standard chrome://tracing format it is easy to parse for both successful and failed builds.

This contains events for the garbage collector, and all executed Starlark functions.

These can be correlated to find which functions are active during, or before, garbage collection events. Additionally, one could collect this information for all failed builds, and see if some functions are overrepresented among the last active functions for each evaluator in the build.

BazelCon 2023

· 2 min read
Fredrik Medley
Fredrik Medley

Meroton visited BazelCon 2023 in Munich October 24-25, 2023. During the conference, we held three talks:

Other talks that mentioned Buildbarn were:

We are thankful for all amazing chats with the community and are looking forward to BazelCon 2024.

Buildbarn Block Sizes

· 3 min read
Benjamin Ingberg
Benjamin Ingberg

When starting out with remote caching, an error you are likely to run into is:

java.io.IOException: com.google.devtools.build.lib.remote.ExecutionStatusException:
INVALID_ARGUMENT: Failed to store previous blob 1-<HASH>-<LARGE_NUM>:
Shard 1: Blob is <LARGE_NUM> bytes in size,
while this backend is only capable of storing blobs of up to 238608384 bytes in size

This is because your storage backend is too small. You are attempting to upload a blob larger than the largest blob accepted by your storage backend.

How do I fix it?

The largest blob you can store is the size of your your storage device divided by the number of blocks in your device.

To store larger blobs, either increase the size of your storage device or decrease the number of blocks it is split into. Larger storage devices will take more disk, while fewer blocks will decrease the granularity which your cache works with.

In bb-deployments this setting is found in storage.jsonnet.

{
// ...
contentAddressableStorage: {
backend: {
'local': {
// ...
oldBlocks: 8,
currentBlocks: 24,
newBlocks: 1,
blocksOnBlockDevice: {
source: {
file: {
path: '/storage-cas/blocks',
sizeBytes: 8 * 1024 * 1024 * 1024, // 8GiB
},
},
spareBlocks: 3,
},
// ...
},
},
},
// ...
}

To facilitate getting started bb-deployments emulates a block device by using an 8GiB large file. This file is small enough to fit most builds while not taking over the disk completely from a developers machine.

The device is then split into 36 blocks (8+24+1+3), where each block can then store a maximum of 238608384 bytes (8GiB / 36 - some alignment).

In production it is preferable to use a large raw block device for this purpose.

What does new/old/current/spare mean?

In depth documentation about all the settings are available in the configuration proto files.

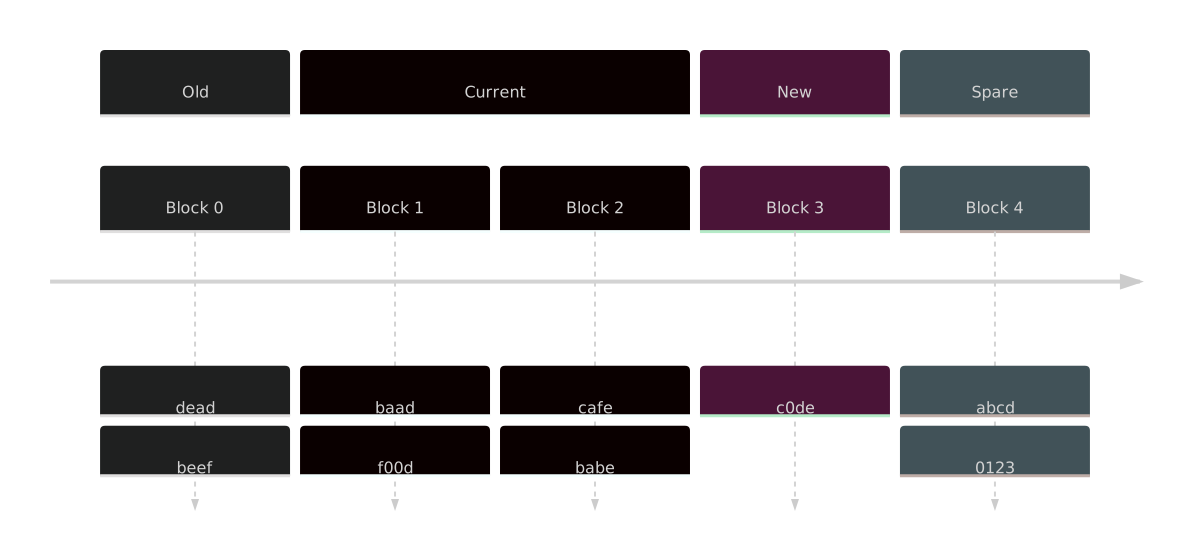
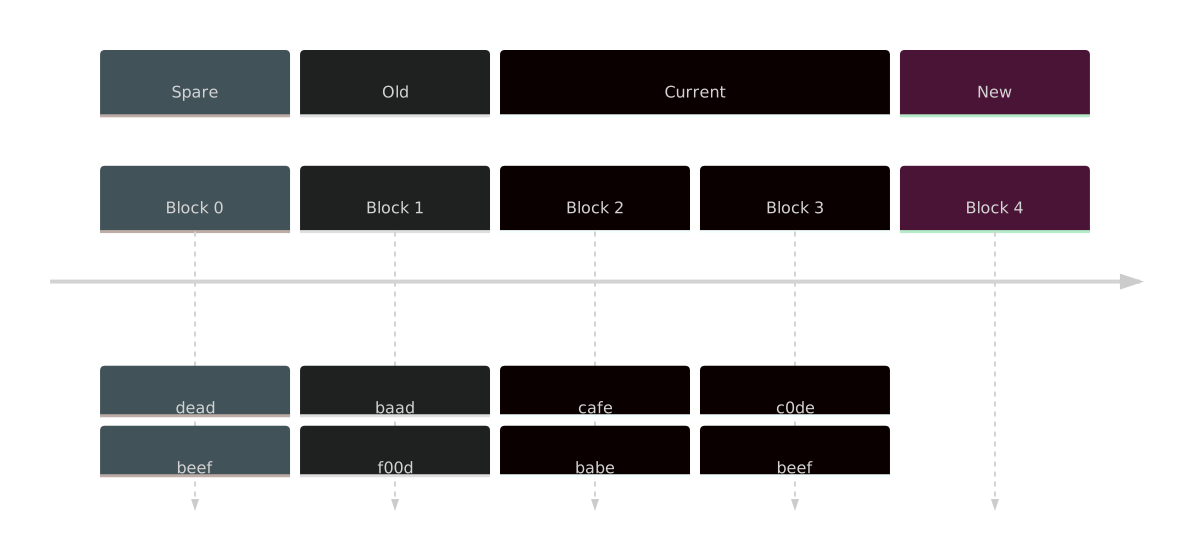
In essence the storage works as a ringbuffer where the assignment of each block is rotated. Consider a 5 block configuration with 1 old, 2 current, 1 new and 1 spare block.

diagram

As data is referenced from an old block it gets written into a new block. When the new block is full the role rotates.

diagram

There are some tradeoffs in behaviour to consider when choosing your block layout. Fewer blocks will allow larger individual blobs at the cost of granularity. Here is a quick summary of the meaning of the different fields.

  • Old - Region where reads are actively copied over to new, too small value and your device behaves more like a FIFO than a LRU cache, too large and your device does a lot of uneccesary copying.
  • Current - Stable region, should be the majority of your device.
  • New - Region for writing new data to, must be 1 for AC and should be 1-4 for CAS. Having a couple of new blocks allows data to be better spread out over the device so as to not expire at the same time.
  • Spare - Region for giving ongoing reads some time to finish before data starts getting overwritten.

Updates to Buildbarn deployment repo as of Febuary 2023

· 4 min read
Benjamin Ingberg
Benjamin Ingberg

The example configuration project for buildbarn bb-deployments has gotten updates.

This is a continuation of the updates from last year article and is a high level summary of what has happened since April 2022 up to 2023-02-16.

Let ReferenceExpandingBlobAccess support GCS

ReferenceExpandingBlobAccess already supports S3 so support was extended to Google Cloud Storage buckets.

Support for prefetching Virtual Filesystems

Running workers with Fuse allows inputs for an action to be downloaded on demand. This significantly reduces the amount of data that gets sent in order to run overspecified actions. This however leads to poor performance for actions which reads a lot of their inputs synchronously.

With the prefetcher most of these actions can be recognized and data which is likely to be needed can be downloaded ahead of time.

Support for sha256tree

Buildbarn has added support for sha256tree which uses sha256 hashing over a tree structure similar to blake3.

This algorithm will allow large CAS objects to be chunked and decompositioned with guaranteed data integrity while still using sha256 hardware instructions.

Completeness checking now streams REv2 Tree objects

This change introduces a small change to the configuration schema. If you previous had this:

backend: { completenessChecking: ... },

You will now need to write something along these lines:

backend: {
completenessChecking: {
backend: ...,
maximumTotalTreeSizeBytes: 64 * 1024 * 1024,
},
},

See also the bb-storage commit 1b84fa8.

Postponed healthy service status

The healthy and serving status, i.e. HTTP /-/healthy and grpc_health_v1.HealthCheckResponse_SERVING, are now postponed until the whole service is up and running. Before, the healthy status was potentially reported before starting to listen to the gRPC ports. Kubernetes will now wait until the service is up before forwarding connections to it.

Server keepalive parameter options

The option buildbarn.configuration.grpc.ServerConfiguration.keepalive_parameters can be used for L4 load balancing, to control when to ask clients to reconnect. For default values, see keepalive.ServerParameters.

Graceful termination of LocalBlobAccess

When SIGTERM or SIGINT is received, the LocalBlobAccess now synchronize data to disk before shutting down. Deployments using persistent storage will no longer observe loss of data when restarting the bb_storage services.

Non-sector Aligned Writes to Block Device

Using sector aligned storage is wasteful for the action cache where the messages are typically very small. Buildbarn can now fill all the gaps when writing, making storage more efficient.

DAG Shaped BlobAccess Configuration

Instead of a tree shaped BlobAccess configuration, the with_labels notation allows a directed acyclic graph. See also the bb-storage commit cc295ad.

NFSv4 as worker filesystem

The bb_worker can now supply the working directory for bb_runner using NFSv4. Previously, FUSE and hard linking files from the worker cache were the only two options. This addition was mainly done to overcome the poor FUSE support on macOS.

The NFSv4 server in bb_worker only supports macOS at the moment. No effort has been spent to write custom mount logic for other systems yet.

Specify forwardMetadata with a JMESPath

Metadata forwarding is now more flexible, the JMESPath expressions can for example add authorization result data. The format is described in grpc.proto.

A common use case is to replace

{
forwardMetadata: ["build.bazel.remote.execution.v2.requestmetadata-bin"],
}

with

{
addMetadataJmespathExpression: '{
"build.bazel.remote.execution.v2.requestmetadata-bin":
incomingGRPCMetadata."build.bazel.remote.execution.v2.requestmetadata-bin"
}',
}

Tracing: Deprecate the Jaeger collector span exporter

This option is deprecated, as Jaeger 1.35 and later provide native support for the OpenTelemetry protocol.

bb-deployments Ubuntu 22.04 Example Runner Image

The rbe_autoconfig in bazel-toolchains has been deprecated. In bb-deployments it has been replaced by the Act image ghcr.io/catthehacker/ubuntu:act-22.04, distributed by catthehacker, used for running GitHub Actions locally under Ubuntu 22.04.

bb-deployments Integration Tests

The bare deployment and Docker Compose deployment have now got tests scripts that builds and tests @abseil-hello//:hello_test remotely, shuts down and then checks for 100% cache hit after restart. Another CI test is checking for minimal differences between the Docker Compose deployment and the Kubernetes deployment.

If there are any other changes you feel deserve a mention feel free to submit a pull request at github using the link below.

Bazel 6 Errors when using Build without the Bytes

· 4 min read
Benjamin Ingberg
Benjamin Ingberg

** UPDATE: ** Bazel has a workaround for this issue preventing the permanent build failure loop from 6.1.0 and a proper fix with the introduction of --experimental_remote_cache_ttl in Bazel 7


Starting from v6.0.0, Bazel crashes when building without the bytes. Because it sets --experimental_action_cache_store_output_metadata when using --remote_download_minimal or --remote_download_toplevel.

Effectively this leads to Bazel getting stuck in a build failure loop when your remote cache evicts an item you need from the cache.

developer@machine:~$ bazel test @abseil-hello//:hello_test --remote_download_
minimal

[0 / 6] [Prepa] BazelWorkspaceStatusAction stable-status.txt
ERROR: /home/developer/.cache/bazel/_bazel_developer/139b99b96c4ab6cba5122193
1a36e346/external/abseil-hello/BUILD.bazel:26:8: Linking external/abseil-hell
o/hello_test failed: (Exit 34): 42 errors during bulk transfer:
java.io.FileNotFoundException: /home/developer/.cache/bazel/_bazel_developer/
139b99b96c4ab6cba51221931a36e346/execroot/cache_test/bazel-out/k8-fastbuild/b
in/external/com_google_absl/absl/base/_objs/base/spinlock.pic.o (No such file
or directory)
...
Target @abseil-hello//:hello_test failed to build
Use --verbose_failures to see the command lines of failed build steps.
INFO: Elapsed time: 3.820s, Critical Path: 0.88s
INFO: 5 processes: 4 internal, 1 remote.
FAILED: Build did NOT complete successfully
@abseil-hello//:hello_test FAILED TO BUILD

The key here is (Exit 34): xx errors during bulk transfer. 34 is Bazel's error code for Remote Error.

The recommended solution is to set the flag explicitly to false, with --experimental_action_cache_store_output_metadata=false. To quickly solve the issue on your local machine you can run bazel clean. However, this will just push the error into the future.

The bug is independent of which remote cache system you use and is tracked at GitHub.

Background

When performing an analysis of what to build Bazel will ask the remote cache which items have already been built. Bazel will only schedule build actions for items that do not already exist in the cache. If running a build without the bytes1 the intermediary results will not be downloaded to the client.

Should the cached items be evicted then Bazel will run into an unrecoverable error. It wants the remote system to perform an action using inputs from the cache, but they have disappeared. And Bazel can not upload them, as they were never downloaded to the client. The build would then dutifully crash (some work has been put into trying to resolve this on the bazel side but it has not been considered a priority).

This puts an implicit requirement on the remote cache implementation. Artifacts need to be saved for as long as Bazel needs them. The problem here is that this is an undefined period of time. Bazel will not proactively check if the item still exists, nor in any other manner inform the cache that it will need the item in the future.

Before v6.0.0

Bazel tied the lifetime of which items already exists in the cache (the existence cache) to the analysis cache. Whenever the analysis cache was purged it would also drop the existence cache.

The analysis cache is purged quite frequently. It would therefore be rare in practice, that the existence cache would be out of date. Furthermore, since the existence cache was an in-memory cache, Bazel crashing would forcefully evict the existence cache. Thereby fixing the issue.

After v6.0.0

With the --experimental_action_cache_store_output_metadata flag enabled by default the existence cache is instead committed to disk and never dropped during normal operation.

This means two things:

  1. The implied requirement on the remote cache is effectively infinite.
  2. Should this requirement not be met the build will fail. And since the existence cache is committed to disk Bazel will just fail again the next time you run it.

Currently the only user-facing way of purging the existence cache is to run bazel clean. Which is generally considered an anti-pattern.

If you are using the bb-clientd --remote_output_service to run builds without the bytes (an alternative strategy to --remote_download_minimal) this will not affect you.

Footnotes

  1. When using Bazel with remote execution remote builds are run in a remote server cluster. There is therefore no need for each developer to download the partial results of build. Bazel calls this feature Remote Builds Without the Bytes. The progress of the feature can be tracked at GitHub.

BuildBar at the Meroton Office

· One min read
Benjamin Ingberg
Benjamin Ingberg

After BazelCon we've all gotten a bit giddy and you might feel excited how the information presented at BazelCon might impact your development workflow. For that purpose we're inviting everyone in the wider bazel community to an open BuildBar at the Meroton offices.

Come over and digest BazelCon with high level technical discussions of the talks, great company, a pleasant atmosphere and also beer.

Feel welcome to come over this Thursday the first of December from 16 to 20.

Directions

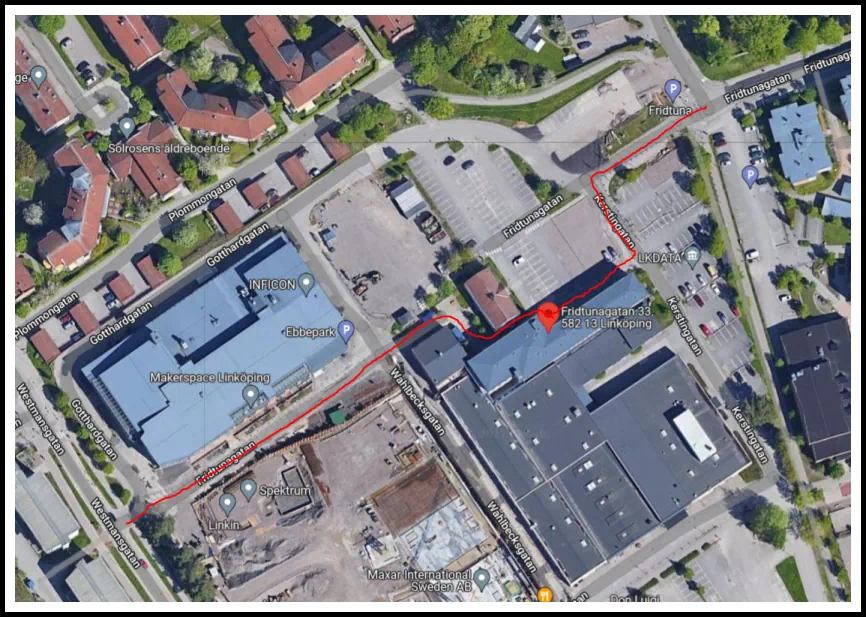
You'll find us at our Linköping offices at Fridtunagatan 33. Currently there is some construction but follow the red lines and you'll be fine.

Fridtunagatan 33 Linköping

Remote Executors for the Free Environment

· 2 min read
Benjamin Ingberg
Benjamin Ingberg

We've performed some updates to the free tier and our pricing model.

Shared Cache

The free tier has been upgraded into an environment with a 1TB cache. This means that you can use the free tier without worrying about hitting any limits or setup process.

Do note that while the cached items will only be accessible with the correct api keys, the storage area can be reclaimed by anyone. I.e. as the cache becomes full your items might be dropped.

With the current churn we expect any items in the cache last at least a week. However, you should always treat items in the cache as something which might be dropped at any moment. The purpose and design of the cache is to maximize build performance, not to provide storage.

Shared executors

New for the free environment is the introduction of remote execution, this was previously only available for paying customers.

If you're using bazel you can simply add the --remote_executor=<...> flag and your builds will be done remotely.

The free environment has access to 64 shared executors.

Starter tier

If you need dedicated storage for evaluation purposes we also offer a starter tier. The starter tier is a streamlined environment with 100 GB of dedicated cache and access to the same 64 executors as the free tier.

This allows you to try out remote execution and caching without being disturbed by others. While the 100GB dedicated cache will only be used by you and therefore not be overwritten by anyone else's build, the cache is still a cache and the system will still drop the cache entries if it determines it is useful for maximizing performance.

Need more executors?

At the moment the starter tier has a fixed amount of shared executors. If you need a scalable solution contact us for setting up a custom Buildbarn environment of any size.

Tips, Tricks & Non-Deterministic Builds

· 2 min read
Benjamin Ingberg
Benjamin Ingberg

When you have a remote build and cache cluster it can sometimes be hard to track down what exactly is using all of your building resources. To help with this we have started a tips and trix section in the documentation where we will share methods we use to debug and resolve slow builds.

The first section is about build non-determinism. Ideally your build actions should produce the same output when run with the same input, in practice this is sometimes not the case. If you are lucky a non-deterministic action won't be noticed since the inputs for the non-deterministic action is unchanged it won't be rebuilt.

If you're not so lucky the non-determinism stems from a bug in the implementation and you should definitely pay attention to them. But how do you know which if any actions are non-deterministic?

This is not trivial but we have added a server side feature which allows detection of non-determinism with virtually no effort on your part.

Once activated it reruns a configured fraction of your actions and automatically flags them if they produce different outputs. The scheduling is done outside of your bazel invocation so your build throughput will be unaffected at the cost of an increase in the number of resources consumed. We suggest 1% which will only increase your resource use by a trivial amount but you could of course set it to 100% which would double the cost of your builds.

Updates to Buildbarn deployment repo as of April 2022

· 2 min read
Benjamin Ingberg
Benjamin Ingberg

The sample configuration project for Buildbarn was recently updated after a long hiatus. As an aid for people to understand which changes have been done see the following high level summary.

April 2022 Updates

This includes updates to Buildbarn since December 2020.

Authorizer Overhaul

Authorizers have been rehauled to be more flexible it is now part of each individual cache and execution configuration.

Using a JWT authorization bearer token has been added as an authorization method.

Hierarchical Blob Access

Using hierarchical blob access allows blobs in instance name foo/bar to be accessed from instance foo/bar/baz but not instance foo or foo/qux.

Action Result Expiration

An expiry can be added to action result which lets the action cache purge the result of an exection that was performed too far in the past. This can be used to ensure that all targets are rebuilt periodically even if they are accessed frequently enough to not normally be purged from the cache.

Read Only Cache Replicas

Cache read traffic can now be sent to a read-only replica which is periodically probed for availability.

Concurrency Limiting Blob Replication

Limit the number of concurrent replications to prevent network starvation

Run Commands as Another User

Allows the commands to be run as a different user, on most platforms this means the bb-runner instance must run as root.

Size Class Analysis

Allows executors of different size classes to be used, the scheduler will attempt to utilize executors efficiently but there is an inherent tradeof between throughput and latency. Once configured the scheduler will automatically attempt to keep track of which actions are best run on which executors.

Execution Routing Policy

The scheduler accepts an execution routing policy configuration that allows it to determine how to defer builds to different executors.

If you see any other changes you feel should get a mention feel free to submit a pull request at github using the link below.

Purpose of the Articles

· One min read
Benjamin Ingberg
Benjamin Ingberg

The purpose of these articles is to have a freeform area discussing ideas, technical issues, solutions and news in an indepth relaxed manner. It is not to serve as reference material, structured reference material should be available in the documentation section.

The article format allows more in depth on discussions for reacurring subjects. In contrast to the documentation published articles aren't changed, if the subject requires a revisit in the future then we publish a new post and add references to the old.

If you see any errors feel free to submit a pull request at github using the link below.